
INDICATORS / ONE MILLION / RADA
Rada — Read Height and Color Separately
Follow Rada through its tall peaks, quieter stretches, and red/teal changes. Compare each event with Money, Cloud, Power, and Matrix before reading the whole One Million picture.
1. Recognize the Rada view
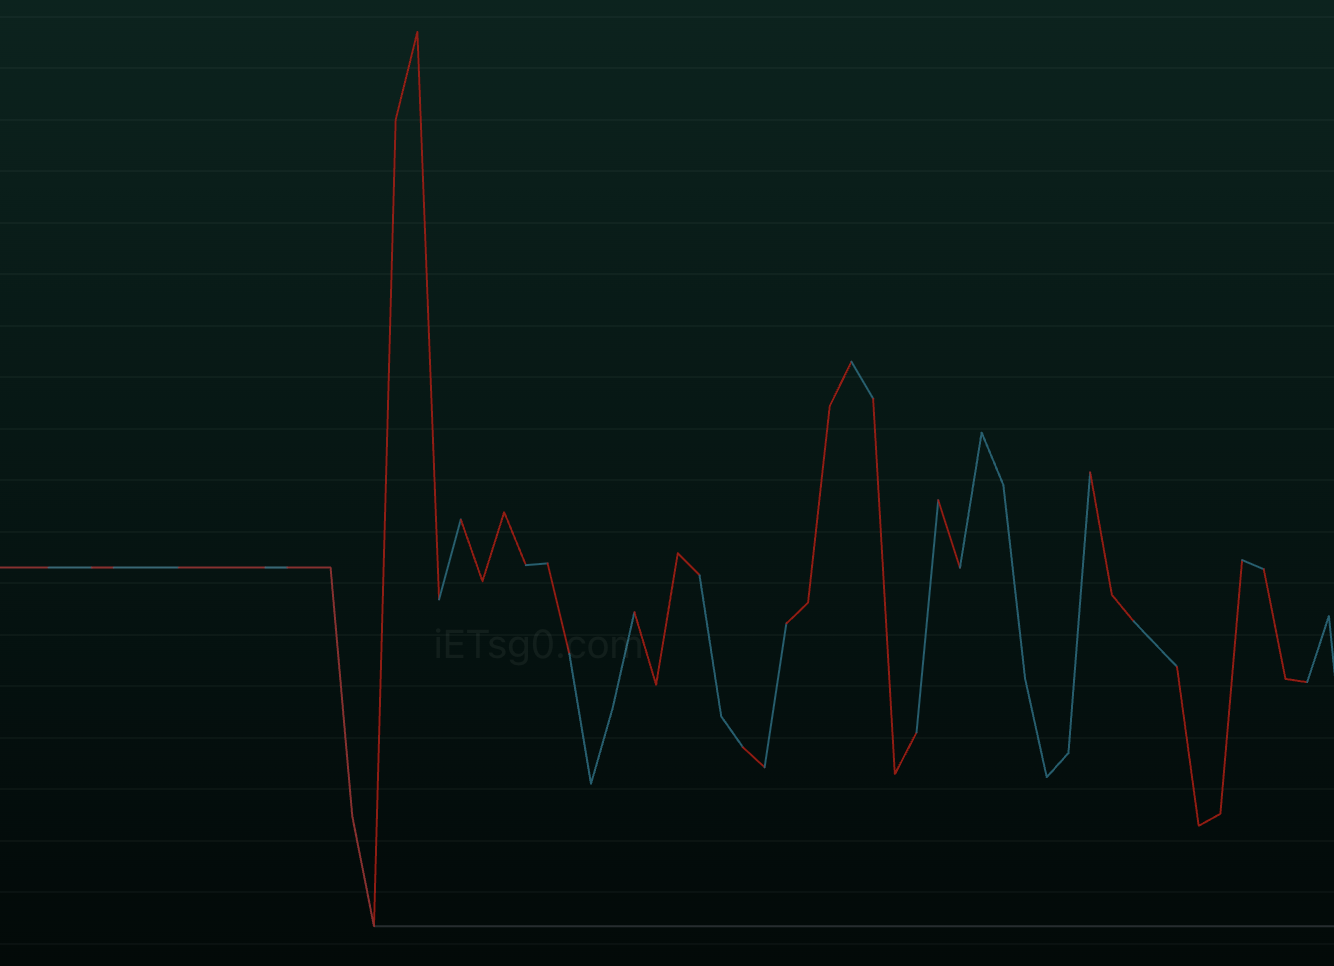
This crop shows the Rada line from iETsg0 [One Million]. Each point belongs to a candle, and the connected line helps you compare changing Rada readings across the chart.
Read height, color, and persistence separately. A tall point describes a stronger Rada reading than nearby lower points. Its red or teal color adds a different part of the picture. Neither one alone describes every part of One Million.
| Feature | Reading question |
|---|---|
| Height | Is this Rada reading large or small compared with the surrounding readings? |
| Color | Is this part of the display red or teal? |
| Persistence | Does the higher reading last, repeat, or immediately fall back? |
| Agreement | Do Money, Cloud, Power, and Matrix change at the same moment? |
2. Compare height within the same view
A tall Rada peak draws attention to a pronounced reading. A lower stretch shows smaller Rada readings in this display. Compare a point with the candles around it rather than treating its height on the screen as a price or percentage.
The bottom horizontal line is a Rada reference. A point near it does not mean the market price is near zero or that the market has stopped moving.
The height is fitted to the indicator panel. Changing the panel size or chart interval can change how the shape looks. Compare like-for-like views rather than measuring pixels across different screenshots.
3. Keep red and teal separate from rising and falling
Red and teal describe different Rada color states. They do not simply mean that the Rada line itself is moving down or up. You can see a red line rise sharply and a teal line descend.
The large red peak left of center makes this distinction clear: Rada rises to its highest visible point while red. Calling every rising segment teal would misread the image. Similarly, teal segments on the right can lose height.
Read the latest height and its color together, then compare the wider One Million view. A tall red peak is not automatically an S, and a tall teal peak is not automatically an L.
4. Distinguish one large event from a lasting change
A lower Rada reading after a peak does not itself establish a price decline. It describes Rada returning to a smaller displayed level.
| Appearance | How to read it | What to watch next |
|---|---|---|
| One very tall peak | A pronounced Rada event at that moment. | Whether later readings stay elevated or quickly return lower. |
| Repeated higher readings | Rada remains more pronounced across several candles. | Whether the other One Million names agree with the repeated activity. |
| Sharp rise followed by a sharp drop | The large reading did not hold at that height. | Whether another higher group forms or lower readings persist. |
| Low, uneven readings | Rada is smaller and still changing. | Whether the next lift develops beyond an isolated point. |
5. Walk through the supplied image
- Far left — a flat stretch: Rada holds almost the same displayed height while small red/teal changes appear. The screenshot alone does not tell you why this section is flat; do not assume the market price was also flat.
- Left of center — an abrupt low and a very large peak: the line drops toward the lower reference, then rises steeply in red to the tallest visible point. This is the most pronounced Rada event in the crop.
- Immediately afterward — the height does not hold: Rada falls sharply from that peak. Smaller alternating rises and declines follow.
- Middle — uneven readings: Rada repeatedly approaches the lower area and lifts again, with red and teal appearing in both rising and falling sections.
- Right-center — several separate peaks: Rada makes another sizable rise, drops, and produces additional smaller peaks. These are separate events rather than one uninterrupted high reading.
- Latest edge — smaller readings remain: after another low area, Rada lifts briefly, settles lower, and changes again near the crop boundary. It has not returned to the height of the largest earlier peak.
6. Read the latest picture without assigning a trade
The latest visible Rada readings are smaller than the earlier major peaks and remain uneven. The image shows repeated changes rather than a sustained return to the earlier high level.
Red and teal are both present, so the line’s direction alone cannot explain the color. Follow the newest completed points and check whether the next larger reading holds.
This crop does not include price candles, the market name, the chosen interval, or the full One Million display. It does not establish the next price direction, an active position, or who is buying or selling.
7. Compare Rada with the other One Million names
Use the same market and interval for these comparisons. A striking Rada peak deserves attention, but attention is different from agreement across the whole indicator.
| Compare with | What to observe |
|---|---|
| Money and Cloud | Do they strengthen at the same moment as the Rada event, or remain weak? |
| Mountain / Home | Does Mountain also change near the Rada peak, and what follows the latest Home or moon reference? |
| Matrix — Rada row | Read the Rada row at the same candle. Its number is a separate display from the line’s height. |
| Power and Matrix count | Is the change spreading across One Million or mostly isolated to Rada? |
| Trust and P/H/S/R | Does the price-chart view agree with the wider reading? |
8. Watch three possible next developments
| Possible development | What to observe | Reading |
|---|---|---|
| Higher readings persist | Several Rada points stay higher while Power, Matrix, Money, and Cloud also strengthen. | The event is lasting longer and appearing alongside broader improvement. |
| Another isolated peak appears | Rada rises sharply and returns lower while the other names do not improve together. | The event remains limited rather than describing shared strength. |
| Rada stays low and uneven | Small rises and declines continue without a lasting higher group. | The latest Rada picture remains subdued compared with the earlier peaks. |
9. Use a simple Rada reading routine
- Select a completed candle and compare its Rada height with nearby readings.
- Read its color separately from whether the line is rising or falling.
- Check whether the event persists, repeats, or fades on later completed candles.
- Compare the same moment with the Rada row in Matrix and the wider One Million view.
- Keep the latest candle separate from completed readings: its Rada height and color can change while it develops.
Need help? Contact support.