
INDICATORS / ONE MILLION / CLOUD
Cloud — Read Color and Agreement
Read the Cloud area, its colored line, and Money together. Follow where they strengthen, fade, or begin to tell different stories in One Million.
1. Separate the three visible parts
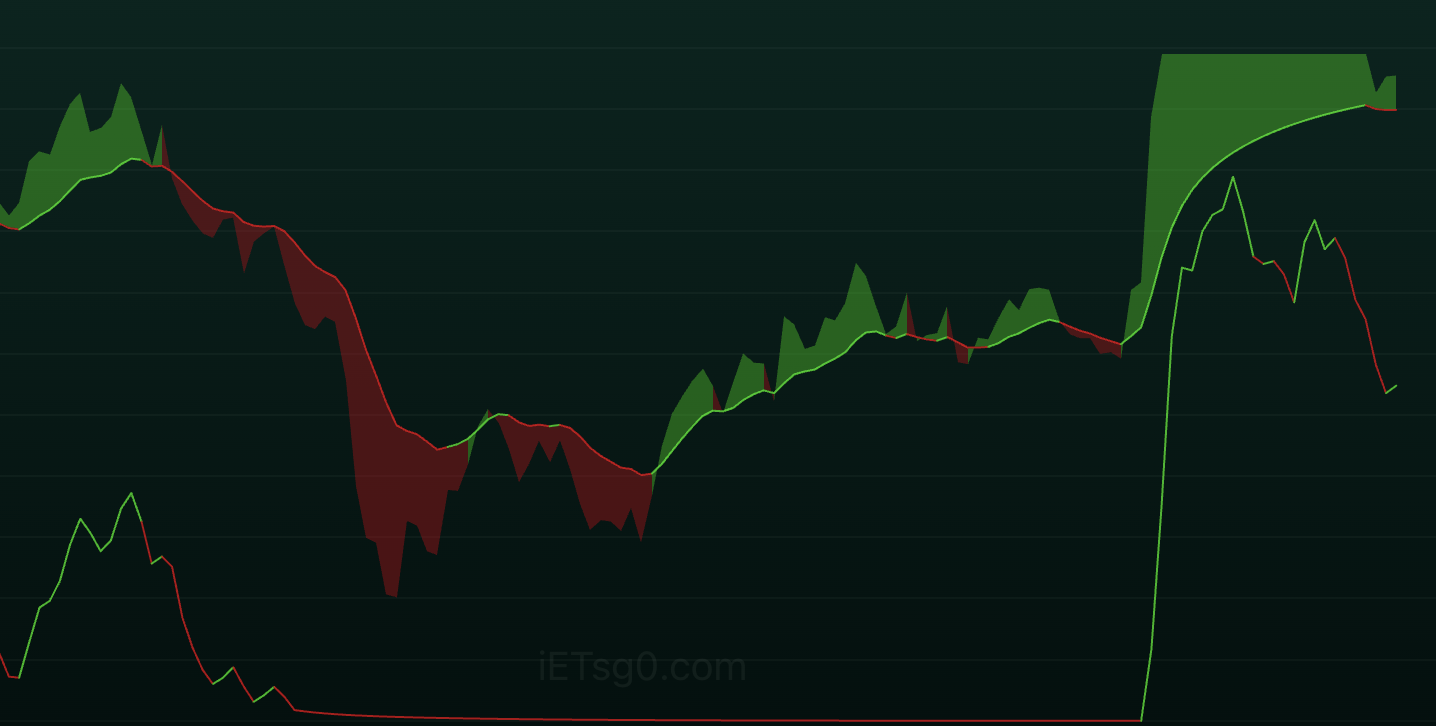
This crop shows Cloud together with the Money line from iETsg0 [One Million]. The broad green/red area belongs to Cloud. A smoother colored line follows that area, while the separate Money line stays near the bottom for much of the middle before rising sharply on the right.
Read each part separately before comparing them. The Cloud area and its line can have different colors at the same moment. The separate Money line is also distinct from the Money columns explained in the previous guide.
| Part | What to observe | Reading question |
|---|---|---|
| Cloud area | The filled green or red shape. | Is green spreading and holding, or is red becoming more visible? |
| Cloud line | The smoother green/red line beside the filled area. | Is the line rising, flattening, or falling, and has its color changed? |
| Money line | The separate green/red line, low through the middle of this crop. | Does Money join Cloud’s improvement or begin to fade while Cloud still looks strong? |
2. Read Cloud color together with its shape
Green and red describe different Cloud states. Read the color across several candles rather than assigning a conclusion to one small patch. A growing green area can show a stronger Cloud picture; a red area spreading alongside a falling line shows a weaker one.
The thickness of the filled area is not a percentage, a cash amount, or a price target. A thin green area and a wide green area can look different without either one deciding the next price move.
Cloud can remain green while its line flattens or briefly turns red. Treat that as a mixed reading within Cloud and inspect the next completed candles. Do not assume every part must change color together.
3. Follow the line as well as the latest color
- A rising green section is easier to read as continuing improvement when it persists across several candles.
- A line losing height or turning red deserves attention even if a large green Cloud area remains above it.
- A small return to green after a decline is an early change to observe, not proof that the previous strength has returned.
- A flat upper edge in the Cloud area does not establish that price has stopped changing. Read the line, the latest filled area, and the other One Million names as well.
4. Compare Cloud with Money
Money and Cloud do not always change together. In this image, Cloud begins improving through the middle while the Money line remains near the bottom. Later Money rises sharply, then falls back even though the Cloud area is still green.
That difference is useful information. It tells you that the two readings are no longer improving together. It does not, by itself, establish what price must do next.
| Visible combination | How to read it |
|---|---|
| Cloud improves and Money rises | Both parts are strengthening at the same time. Watch whether they hold. |
| Cloud improves but Money stays low | Cloud is improving without Money yet showing the same strength. |
| Cloud stays green while Money falls | The green Cloud picture is no longer accompanied by continuing Money strength. |
| Cloud weakens and Money also falls | Both readings are giving back strength. Compare the wider One Million view. |
5. Walk through the supplied image
- Left — an initial green period: the Cloud area is green and its line rises. Money below also lifts, but does not sustain that rise.
- Left-center — the picture weakens: the Cloud line turns red and falls, with a broad red area developing. Money also drops toward its lower area.
- Middle — Cloud begins to rebuild: red gives way to a series of green patches and the Cloud line gradually climbs. Money remains close to the bottom through much of this stretch, so the improvement is not yet shared by both parts.
- Right-center — improvement becomes more visible: Cloud continues higher with some short mixed-color sections. Read the green patches together with the line rather than treating each patch as a separate instruction.
- Near the right — a sharp shared lift: Cloud expands into a large green area while Money rises abruptly from its low position. Both parts strengthen during this stretch.
- Latest section — Money gives back strength: after its sharp rise, Money falls, briefly lifts again, then drops further. Cloud remains broadly green, but its line turns red near the latest edge. The small final green turn in Money has not recovered its earlier height.
6. Read the latest edge carefully
The clearest latest reading is a still-green Cloud area with softer behavior in both lines: Money has fallen substantially from its recent high, and the Cloud line has begun to turn red. This is a mixed picture rather than continuing shared improvement.
The small green end of Money is worth observing, but a short change in color does not erase the decline before it. Compare whether later Money readings recover and whether the Cloud line turns upward again.
This image omits the price candles, market name, selected interval, and other One Million readings. It shows a change in Cloud and Money; it does not establish the next price direction or an active L/S position.
7. Watch three possible next developments
| Possible development | What to observe | Reading |
|---|---|---|
| Shared improvement returns | Money rebuilds across several candles and the Cloud line resumes a rising green section. | The two parts are beginning to strengthen together again. |
| Weakness spreads | Money stays low or falls further while the Cloud line remains red and red appears more broadly in the filled area. | The loss of strength is becoming more visible across the view. |
| The picture remains mixed | Cloud stays mostly green while Money alternates between small lifts and declines. | There is still no sustained shared improvement between the two parts. |
8. Bring Cloud into the full One Million reading
- Compare the Money and Cloud rows in Matrix at the same candles. Check whether both improve, or whether one remains weaker.
- Read Power and the Matrix count for the wider picture. A large green Cloud area alone does not mean every One Million row is strong.
- Compare Trust and P/H/S/R on the price chart. Keep differences visible rather than letting one color decide the whole interpretation.
- Use the same market and interval across these views. Compare completed candles and watch whether the changes persist.
- The latest colors and shapes can change while a candle develops. A saved image records only one moment.
Need help? Contact support.