
INDICATORS / ONE MILLION / POWER & MATRIX
Power & Matrix
Read Money, Cloud, Mountain, and Rada alongside Power and Matrix. See when the One Million readings strengthen together, disagree, or fade.
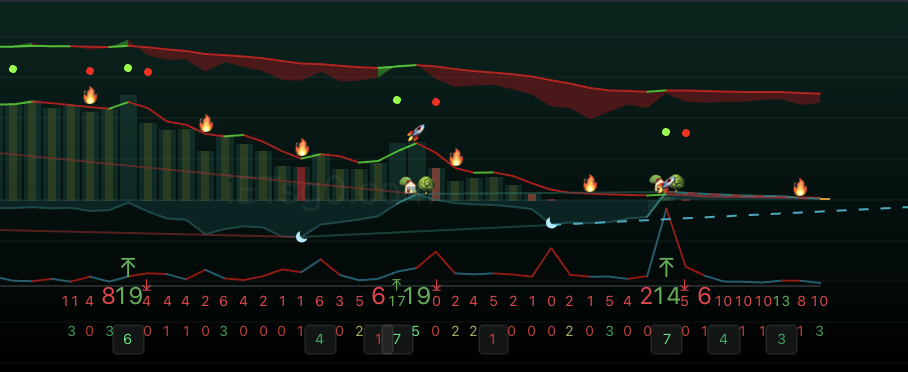
1. Read the One Million panel from top to bottom
Start with Cloud and Money, then compare Mountain and Rada. Finish with Power and Matrix. Look at the same candles across the panel so you can see which parts improve together.
The heights in this panel belong to the One Million display. They are not market prices. Compare each part with its own earlier appearance.
| One Million name | What to look at | What to compare |
|---|---|---|
| Cloud | The upper colored area and its edge. | Whether green or red persists across the next candles. |
| Money | The colored columns and the line beside them. | Whether the columns build or shrink together. |
| Mountain / Home | The teal area with moon and home symbols. | Whether it rises from a low or falls from a high. |
| Rada | The lower red/teal line above the number rows. | Whether a stronger Rada reading is joined by stronger Power and Matrix. |
| Power / Matrix | The two number rows. | Whether improvement lasts beyond one candle. |
2. Compare Cloud and Money
Cloud gives you a broad visual reference at the top of the panel. Watch whether green expands and holds, or whether red remains dominant. Its edge and filled area can show different colors during a change.
Money columns can become taller, smaller, or change color. Read the columns together with the Money line. One green moment among mostly red readings does not establish that the whole picture has changed.
Small green and red dots draw attention to changes in this part of the display. In this example, green dots appear even while the upper Cloud remains largely red. Compare what follows each dot.
3. Follow Mountain, Home, and Rocket
Watch Mountain rise or fall relative to its recent shape. A rise from a low can show improvement while other parts of One Million are still weak. A fall from a high can show fading strength even before the other colors change.
The lines between references help you follow their relationship. An extended line is a visual reference, not a promised future path.
| Symbol | One Million reference | What to remember |
|---|---|---|
| ☾ | Lower Mountain / Home reference. | Its location can change as the picture develops. |
| 🏡🌳 | Upper Mountain / Home reference; shown as 🌙 on the price chart. | Compare it with the surrounding Money and Cloud colors. |
| 🚀 | Rocket reference. | Read it with Power and Matrix rather than by itself. |
| 🔥 | Fire reference in the Rocket view. | It does not establish that price has finished falling. |
4. Read Rada with Power and Matrix
Rada is the lower red/teal line just above the scores. Compare a tall Rada reading with the surrounding smaller readings, then check whether Power and Matrix strengthen at the same time.
In the right-center of the image, a pronounced Rada peak appears near Power 21 and Matrix 7. Several readings stand out together. The next candles show whether that stronger picture lasts.
A Rada peak alone does not mean an L or S must appear. Keep Money, Cloud, and the price-chart view in sight.
5. Keep Power, Matrix, and Trust separate
| Name | Where to read it | Meaning for the reader |
|---|---|---|
| Power | Upper number row. | The overall Power reading at each candle. Compare its current level with the preceding readings. |
| Matrix | Lower number row. | How broadly improvement is showing across One Million. Compare it with Power. |
| Trust | Trust percentage and candle colors in the first guide. | A separate One Million reading; the two rows here are not Trust percentages. |
- Green and red Power numbers make stronger and weaker readings easier to compare. Power 19 or 21 is not a percentage or price target.
- A higher Matrix count indicates broader improvement in the One Million view. It does not promise the next price move.
- Boxes around Matrix numbers draw attention to selected changes. Compare the number and surrounding readings; a box alone does not mean every part is strong.
- Larger Power numbers are visual emphasis. They use the same Power reading as the smaller numbers.
6. Understand the Power arrows
⤒ draws attention to a sharp upward change in Power; ⤓ draws attention to a sharp downward change. Compare the arrow with the readings before and after it.
The number beside the arrow in this panel is the current Power reading. The matching price-chart label can show the change with a plus or minus sign. Keep these two displays separate.
An upward arrow can be followed by lower Power. The arrow describes a change that occurred, not a promise that it will continue.
7. Walk through this image
The crop does not include the price candles or market interval. It supports a reading of the One Million panel at this moment, not a definite conclusion about the next price move.
- Left: Cloud becomes mostly red and Money columns grow smaller. Occasional green dots appear, but the broader picture remains weak.
- Middle: Mountain lifts from a lower moon reference, followed by Rocket and Home symbols. Power briefly reaches stronger readings. Compare these moments with the still-small Money columns.
- Right-center: Rada rises sharply near Power 21 and Matrix 7. This is a moment of stronger agreement across several One Million readings.
- Afterward: Power returns to lower values, including 6 and readings around 10. Matrix also contracts, while Cloud remains largely red and Money stays small. The improvement has not held across the whole panel.
- Far right: a fire symbol appears near Money. Observe what comes next rather than treating this symbol as a completed change in price direction.
8. Compare three possible developments
| Possible development | What to watch | How to read it |
|---|---|---|
| Strength spreads | Power stays stronger, Matrix improves, Money builds, and Cloud becomes greener. | More parts of One Million agree with the initial improvement. |
| Strength fades | Power and Matrix fall back while Money remains small and Cloud stays red. | The earlier stronger moment no longer describes the latest picture. |
| Readings remain mixed | Mountain improves while Cloud, Money, Power, and Matrix do not improve together. | Keep observing until the picture becomes clearer. |
9. Bring the two One Million views together
- Use the same market and interval for the price chart and One Million panel.
- Read Cloud, Money, Mountain, Rada, Power, and Matrix, then compare Trust and P/H/S/R in the first guide.
- Where Swim, Pilot, or Pool is displayed, keep the names shown in your indicator. Read Pool 1, Pool 2, Pool 3, Pool 4, and Pool 5 as separate Pool items, then compare the overall Pool reading.
- For Power notifications, select the exact One Million name, such as ⤒ Power Spike UP or ⤓ Power Spike DOWN. Check your market and interval before saving.
- Watch completed candles and when the symbols first appear. Readings and symbol positions can change while the chart develops.
Need help? Contact support.