
INDICATORS / PILOT
Pilot — Read the Line, Stars, and Dots
Follow Pilot through its green, yellow, and red sections. Read the line, stars, and larger colored dots together, while keeping the background and small dotted rows separate.
1. Find Pilot before reading the background
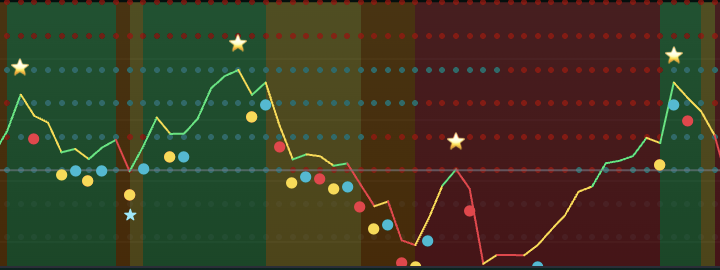
Pilot is the continuous colored line running through this image. It changes between green, yellow, and red as its reading develops. Begin with the line’s direction and position, then compare the marks placed near it.
The small dots arranged in horizontal rows and the broad colored background belong to the surrounding view. They are separate from Pilot’s larger red, yellow, and aqua dots. A green background does not mean every section of Pilot must also be green.
2. Read color and direction together
Yellow needs particular care: it can appear on a decline or on a recovery. Read the direction of the line before deciding which story the yellow section tells.
A small turn in Pilot is different from a sustained run across several candles. Compare the newest reading with the preceding group rather than treating each color change as a separate trade.
| Pilot appearance | How to read it | What to observe next |
|---|---|---|
| Green and rising | Pilot is building strength in its upper side. | Whether the rise holds across the next candles. |
| Yellow and falling | Pilot is giving back strength from a higher reading. | Whether it steadies or continues toward the lower area. |
| Yellow and rising | Pilot is improving from its lower side. | Whether the lift continues and reaches a stronger section. |
| Red and falling | Pilot is weakening in its lower side. | Whether it keeps falling or begins to lift again. |
3. Use the middle guide as a visual reference
The horizontal guide through the middle of Pilot’s displayed range helps you distinguish upper and lower readings. Watch whether Pilot holds above it, remains below it, or moves back and forth around it.
A touch or a move through the guide is something to observe, not an automatic L/S instruction. Compare the following line sections and the wider iETsg0 picture.
The line height belongs to Pilot. It is not a price, a percentage return, or an account balance. The crop cuts off some of the lower marks, so use the full panel when inspecting the deepest area.
4. Read the larger Pilot dots
These larger dots sit below the line for readability. Their vertical position is not a second Pilot value. Compare the candle where a dot appears with Pilot directly above it.
Follow the sequence from red through the lower yellow reference to aqua. The sequence helps organize the movement, but does not promise that the aqua turn will become a lasting rise.
The small dots behind Pilot are a different display. Do not count them as extra Pilot marks or confuse their colors with the larger dots.
| Dot | Meaning in the Pilot view | What to remember |
|---|---|---|
| Red | Marks the beginning of a tracked downward stretch. | Observe whether the decline continues or soon changes. |
| Yellow | Marks the tracked lower point in that stretch. | It can move while a lower Pilot reading develops. |
| Aqua | Marks a turn upward after that tracked downward stretch. | A turn upward can be brief; watch whether it lasts. |
5. Understand the Pilot stars
⭐ marks an upper Pilot reference, while ★ marks a lower Pilot reference. Compare each symbol with the line around it and what happens afterward.
The stars are references rather than instructions to open S at an upper star or L at a lower one. They include spacing above or below Pilot, so their exact screen height is not another reading.
An active star can move when a new Pilot extreme develops. Its final location in a screenshot does not establish that the symbol was already fixed there at that earlier moment.
6. Walk through the supplied image
- Left — an upper reference followed by fading strength: Pilot rises near an upper star, then turns into a yellow decline. The larger dots help follow the intervening downward stretch and upward attempts.
- Left-center — a lower reference and recovery: Pilot dips toward the middle guide, with a lower star beneath the area, then rebuilds. The rise develops into a stronger green section and reaches another upper star.
- Middle — the rise loses strength: yellow and red sections lead Pilot downward. Several brief lifts fail to hold and the line moves into the lower area. Some dots at the bottom are clipped by the crop.
- Later — an attempted lift fails: Pilot returns near the middle guide and an upper reference appears, but the next red drop carries the line lower again. The preceding rise was not sustained.
- Right-center — a more persistent rebuild: a yellow rise develops from the low, then a green section carries Pilot into the upper area. Compare this longer recovery with the shorter earlier attempts.
- Latest edge — a fresh decline begins: after the rightmost upper star, Pilot turns yellow and falls toward the middle guide. A nearby red dot marks the downward stretch. The image ends before showing whether this decline steadies or continues.
7. Read the latest Pilot state separately
The latest visible Pilot movement is giving back part of the preceding rise. The right-side recovery reached an upper reference, but the final line section is falling rather than continuing upward.
That observation belongs to Pilot. The background remains a separate readout, and the small dotted rows still need their own review. A green area behind the latest star does not erase the subsequent decline in the line.
Price candles, the market name, the selected interval, and the full view are absent. The image does not establish an active position, a new Bull/Bear event, or the next price direction.
8. Watch three possible next developments
| Possible development | What to observe | Reading |
|---|---|---|
| Pilot resumes its rise | The decline steadies and Pilot turns upward over later completed candles. | The latest loss of height is beginning to give way to renewed improvement. |
| The decline continues | Pilot keeps falling toward or into its lower area. | More of the preceding rise is being given back. |
| Pilot stays mixed | Short yellow and green lifts alternate with fresh declines around the middle guide. | The line has not yet established a lasting direction across several candles. |
9. Compare Pilot with the wider view
- In Swim & Pool, compare Pilot with Swim and all five Pool items at the same candles.
- Read the latest named state and historical Bull/Bear labels separately from Pilot’s dots and stars.
- In One Million Matrix, Pilot is the bottom of the eight named rows. Its row number is separate from the height of this line.
- Compare Power, the Matrix count, Trust, and P/H/S/R. P in that panel refers to Pilot, but the panel color is a separate readout from the colored line here.
- Use the same market and interval for each comparison. Focus on whether changes persist across completed candles.
- The current Pilot line, dots, and stars can change while the chart develops. Keep the latest unfinished candle separate from the completed history.
Need help? Contact support.