
INDICATORS / iETsg0 [One Million]
iETsg0 [One Million]
Read the story behind each move with Trust colors, Pilot, Home, Swim, and Rocket. Follow the colors and symbols together to understand what One Million is showing.
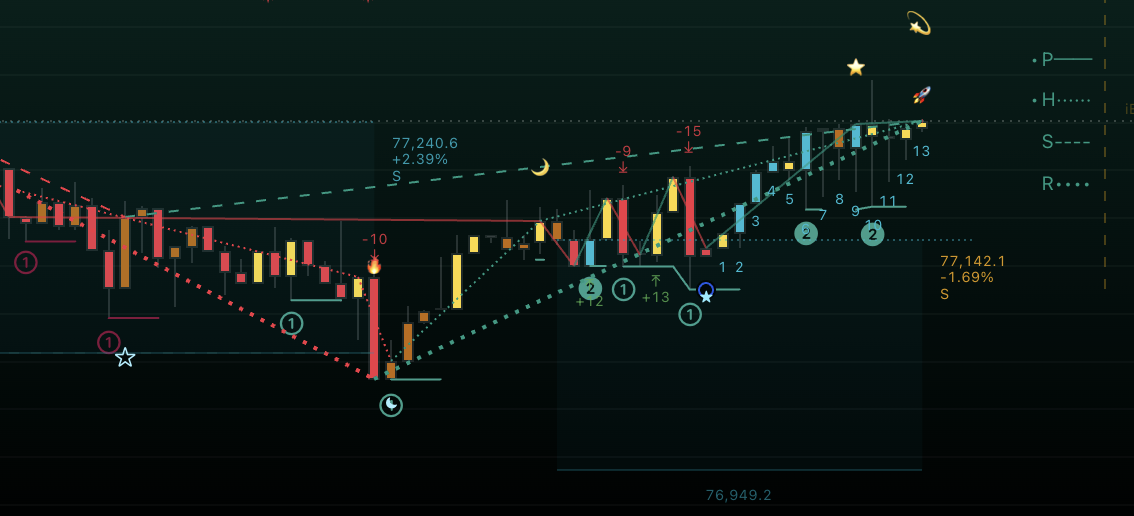
Start with One Million
Money, Cloud, Mountain, Rada, Swim, Pool, Mark, and Pilot each provide a different part of the One Million view. Trust, Power, and Matrix help you read the picture together.
Begin with Trust colors. Compare Pilot, Home, Swim, and Rocket on the right. Then locate the moon, star, rocket, and fire symbols. Finish by reading the L/S labels separately.
1. Read the Trust colors
Trust is the percentage displayed by One Million. It helps you compare stronger and weaker readings as the chart develops. It does not give a probability of profit.
Use the color as a description of the current Trust reading. Compare several candles rather than deciding from one color alone.
| Color | Trust display | Reading |
|---|---|---|
| Red | Below 25% | Low Trust. Watch whether the reading begins to improve. |
| Brown / orange | 25% to below 50% | Trust has some strength but remains in its lower range. |
| Yellow | 50% to below 75% | A stronger Trust reading. Compare with P/H/S/R. |
| Aqua | 75% and above | High Trust at this moment. Watch whether it holds. |
2. Compare Pilot, Home, Swim, and Rocket
P/H/S/R is the compact display at the right edge. Read the four colors together. Teal across all four shows agreement toward the upward side; red across all four shows agreement toward the downward side. Mixed colors show a mixed picture.
| Letter / appearance | Lower symbol | Upper symbol |
|---|---|---|
| P — Pilot · solid line | ★ | ⭐ |
| H — Home (Mountain) · fine dots | ☾ | 🌙 |
| S — Swim · dashes | ☆ | 💫 |
| R — Rocket · bold dots | 🔥 | 🚀 |
- A colored dot beside a letter draws attention to price moving beyond a recent reference for that part of One Million.
- The S here means Swim. An S beside a position price means Short.
- Compare the four letters with Trust. Agreement between the letters alone does not mean an L or S must appear.
3. Read the symbols and small numbers
Moon, star, rocket, and fire symbols mark reference points for Home, Pilot, Swim, and Rocket. They help you follow the chart from one reference to the next. A symbol alone does not promise the next price direction.
Small aqua numbers below candles count candles after a recent lower reference. Warm-colored numbers above candles count after an upper reference. They describe how far the chart has progressed from those references, not a price target.
Circled ➀ and filled ❷ are separate One Million labels. Read ❷ as a strengthened classification compared with ➀, then compare the surrounding Trust colors. A ❷ does not mean a second trade or an automatic L.
Some symbols become visible after the candle where they are placed. Others can move while the chart develops. Read the latest display without assuming each symbol was already visible at its final location.
4. Read L/S labels separately
L means Long and S means Short in the position display. The accompanying price is the position reference; the percentage describes that position. It is separate from Trust.
The example shows 77,240.6 / +2.39% / S and 77,142.1 / −1.69% / S. These are separate S readouts. The image alone does not identify which is still active or all settings behind the displayed result.
Labels can describe an open position or a retained previous position. A displayed position does not establish that an order was placed in your trading account.
5. Follow the supplied image
- Left: price falls alongside many red and brown Trust candles. The red lines agree with the weaker picture.
- Center: the sharp fall reaches the lower moon area near the fire symbol. Treat this as a reference to observe; the later recovery was not yet known.
- Middle to right: yellow and aqua Trust candles become more frequent as price recovers. Teal lines and the small aqua counts help you follow that improvement.
- Right edge: P/H/S/R are teal in the image. Compare that agreement with the latest Trust candles. Upper symbols are also present, but they do not establish where the next move will go.
6. Watch what happens next
| Possible development | What to watch | How to read it |
|---|---|---|
| Improvement continues | Yellow/aqua Trust holds and P/H/S/R stay teal. | The One Million readings continue to agree. |
| Improvement fades | Trust returns toward brown/red and P/H/S/R become mixed or red. | The earlier stronger picture needs to be reassessed. |
| The picture stays mixed | Trust colors alternate and P/H/S/R disagree. | Give the next candles time to clarify the picture. |
7. Set up your One Million view
- Keep both the price chart and the One Million panel visible while learning.
- Enable iETsg0 Analytics Intelligence with your access details. Enable Label if you want to see the L/S readouts.
- Select the exact notification name you want to follow, such as iETsg0 LONG, iETsg0 SHORT, TRADE EXIT, Trust UP, Trust DOWN, or iETsg0 Buy. These describe different events.
- Check that the chart and notifications use your intended market and interval. For observations after a candle finishes, use Once Per Bar Close where available.
8. Read a developing chart with care
Trust, lines, and symbols can change while the latest candle develops. A reference may move as new candles arrive.
Compare completed candles and watch when labels first become visible. An image shows one moment; it does not show everything that happened before or after it.
Need help? Contact support.