
INDICATORS / MARK
Mark — Read the Background and Dots
Read the overall color alongside the individual dots. Learn why a greener background can appear while some rows remain red, and how to compare that picture with Mark in One Million.
1. Separate the overall picture from individual rows
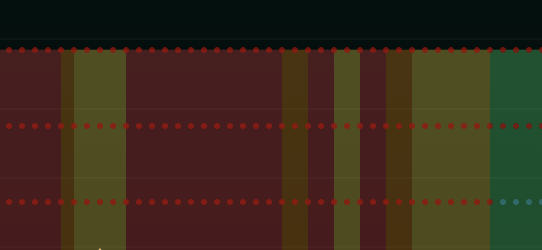
The image contains two kinds of information: a background that changes color and rows of small colored dots. Read the background as an overall visual state, then inspect each visible row for agreement or disagreement.
Mark is the named part of One Million used to read the broader picture. In the companion Swim & Pool view, the colored background and named state provide another way to review that picture. The Mark number in Matrix, the background, and an individual dot are separate readouts.
This crop has no row names or full-panel context. It is useful for studying color and agreement, but it does not establish the identity of each of the three visible rows. Use the full chart labels before assigning a name or interval.
2. Read the background colors
These names describe indicator states. They do not identify who is buying or selling, and they do not promise the next price direction. The colors do not have to appear in a fixed sequence.
A narrow band marks a brief displayed state; a wider band shows that state over more candles. Width is not a measure of profit or certainty. Dark styling can make yellow and orange look muted, so confirm the name in the full view.
| Color | Name in the full view | Reading question |
|---|---|---|
| Red | 🚗 Market Down | Does the weaker overall picture persist, or begin to improve? |
| Orange | 🐻 Distribution | Which parts remain weak and which are changing? |
| Yellow | 🍌 Accumulation | Does the developing picture gain agreement or fade again? |
| Green | 🍀 Market Up | Does the stronger overall picture hold while individual rows catch up or remain mixed? |
- The full Swim & Pool view uses four named states with corresponding colors. Use the actual named label in your full chart to confirm the displayed state; this screenshot does not include that label.
3. Read the dotted rows independently
Read across a row to follow its color through time. Read down a column to compare the visible rows at the same candle. A row remaining red while another turns teal tells you that the readings have not changed together.
In the full interval display, use the labels at the right edge to identify each row. Do not call these three cropped rows Pool 1–3 or assign intervals just because three rows are visible.
Some of the full view is outside this image. A count of the visible teal dots alone cannot establish the complete overall state.
4. Understand a green background with red dots
A background summarizes a broader picture; one dot describes one row. A greener overall state does not require every visible row to become teal at the same moment.
This distinction matters at the right edge: the background becomes green and the bottom visible row turns teal, while the top two visible rows stay red. The correct observation is improving overall color with disagreement still visible in the rows.
Do not infer that the bottom row alone caused the background change. The crop omits other readings and cannot explain that relationship by itself.
5. Walk through the supplied image
- Left — a mostly red starting picture: the background is red and the three visible dotted rows are red. There is little visible agreement toward the teal side in this part of the crop.
- First color change — the background improves briefly: orange/yellow blocks appear, but the visible dotted rows remain red. The overall color changes before these rows show shared improvement.
- Middle — red returns: a broader red stretch follows. The earlier brighter background did not persist through this whole period.
- Later — several transitions appear: narrower red, orange, and yellow blocks alternate. Read these as changes in the displayed background, not as an instruction for every separate band.
- Right edge — a greener state with mixed rows: the background becomes green and the lowest visible row turns teal. The two upper rows remain red, so complete agreement is not visible in this crop.
6. Read the latest state with its limits
The latest visible change is an improvement in the background and in one of the three visible rows. It is not evidence that every row in the full view has turned teal.
Open the full chart to check the row labels, remaining rows, Swim, and the named state. Then compare the same candle with Mark in Matrix. The crop alone does not show the current Mark number.
Price candles, the market name, and the selected interval are absent. This image does not establish an L/S position, a Bull/Bear event, or what price will do next.
7. Follow three possible next developments
| Possible development | What to observe | Reading |
|---|---|---|
| Agreement broadens | The background stays green and more identified rows hold teal across later candles. | The stronger overall appearance is joined by wider visible agreement. |
| The picture stays mixed | Green persists in the background while some rows remain red. | The overall state and individual rows still need to be read separately. |
| The improvement fades | The background returns toward yellow, orange, or red, and teal rows fail to hold. | The latest improvement has not developed into a lasting shared picture. |
8. Compare Mark with the wider iETsg0 view
- In One Million Matrix, locate Mark: it is the seventh of the eight rows, between Pool and Pilot in the supplied layout.
- Read the Mark number alongside the other Matrix rows. Keep its number separate from background colors and individual interval dots.
- Compare Power and the Matrix count to see whether other parts of One Million improve at the same time.
- In Swim & Pool, inspect the full interval rows, Swim, Pool 1–5, Pilot, and the actual named state rather than relying on a cropped background alone.
- Use the same market and interval for each comparison. Observe completed candles and whether changes persist.
- The latest colors and readings can change while the chart develops. Keep the current candle separate from completed history.
Need help? Contact support.